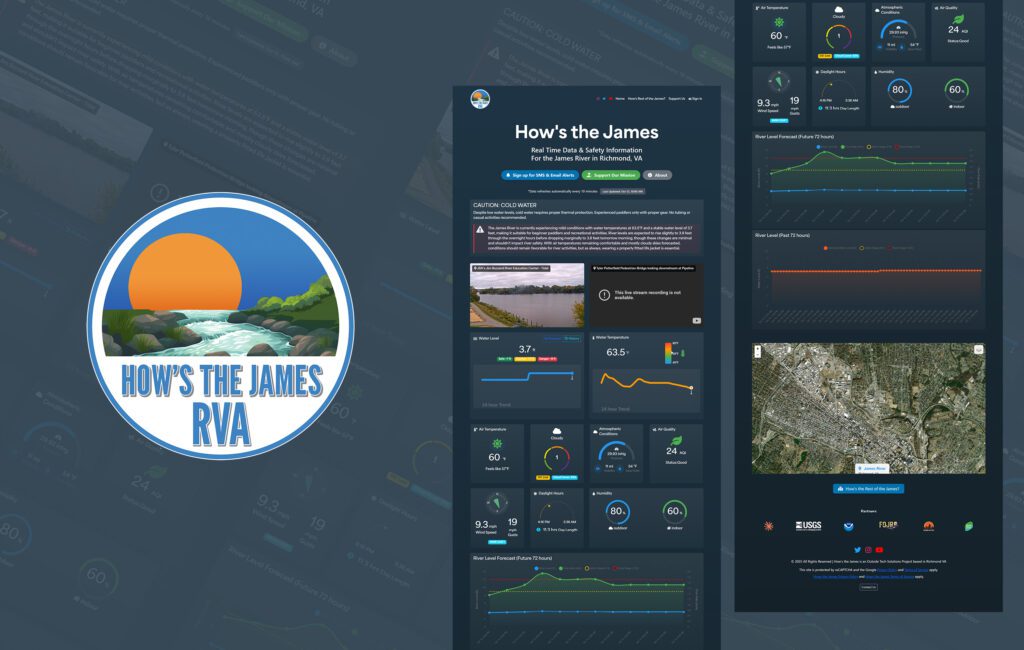
Hows the James RVA is a publicly available website that delivers real time water, weather, and safety alerts on the James River in Richmond, Virginia.
Our role involved developing the real time data pipeline, the dashboard user interface and the automated social posting system that publishes updates about the James River every 10 minutes. Constructed a mobile optimized dashboard using real time charts, predictive graphs, and a visible color coded design that could be easily used in the outdoor setting as well.
Our responsibilities included full stack development which involved integration of various environmental data APIs, building the background scheduling system, development of a responsive and fast frontend, maintenance of a stable uptime and security access to it by the public.
Hows the James RVA is a web site that provides real time water, weather, and safety information on the James River, Richmond, Virginia. It provides real-time environmental information based on USGS and NOAA sources. Converts raw sensor data into understandable and useful safety information to residents, paddlers, and visitors. The platform also drives a live river conditions board as well as publishes automatic updates on social media keeping thousands of users connected and safe after visiting or exploring the river.
The site was a trusted source of disaster and alert information to the Richmond river community. Thousands of followers have their services delivered each day via automated updates and have increased the response time in case of water safety alerts. Through environmental data automation, civic centred technology as well as social media interaction, Hows the James RVA demonstrates how web current platforms can enhance the safety of people, build communities trust including the advancement of environmental awareness in real time.

Developed a pipe that will retrieve and process live updates in USGS and NOAA every 10 minutes, and the Redis caching environment is used, to ensure real-time updates and less server load on APIs.
Created a rule based system, whereby raw gauge readings are converted to understandable color coded safety levels, which includes Safe, Caution, and Danger that are displayed immediately at the dashboard.
Introduced backend schedulers to release structured updates with condition icons and hashtags to twitter X and Instagram via their APIs and ensure that the public became regularly informed.